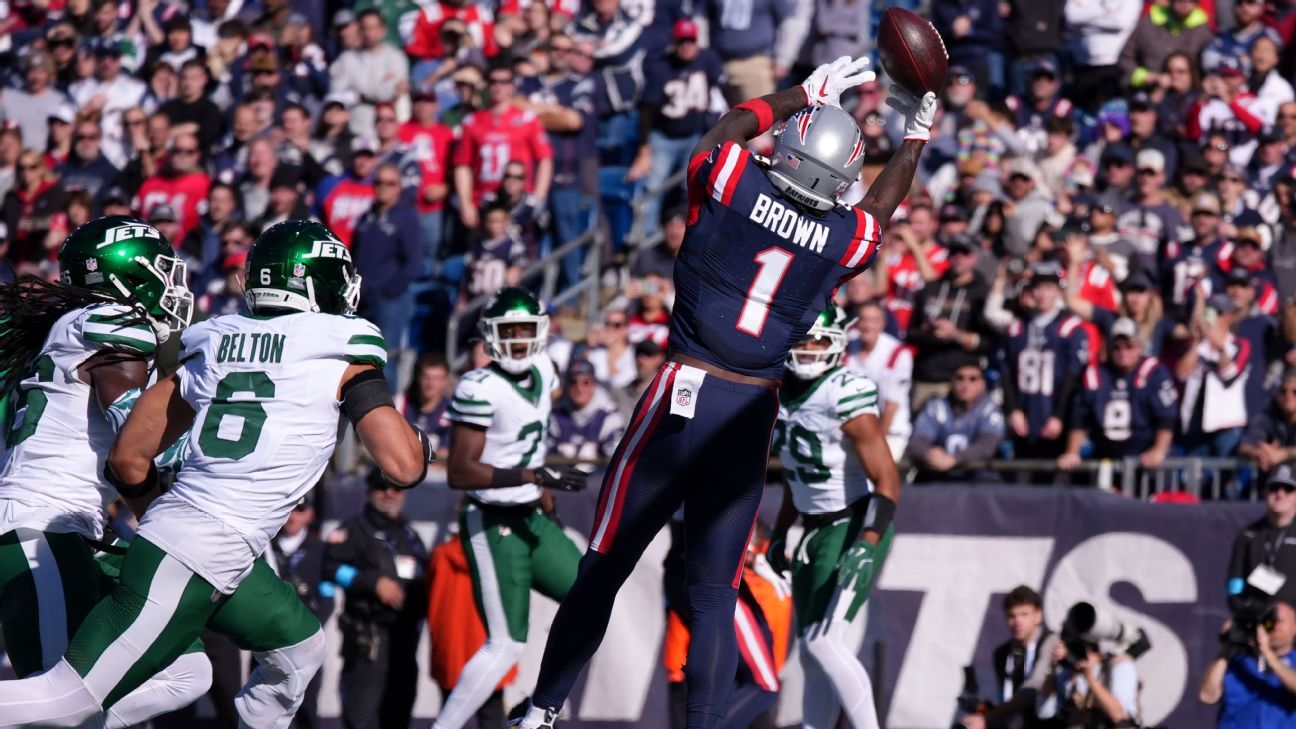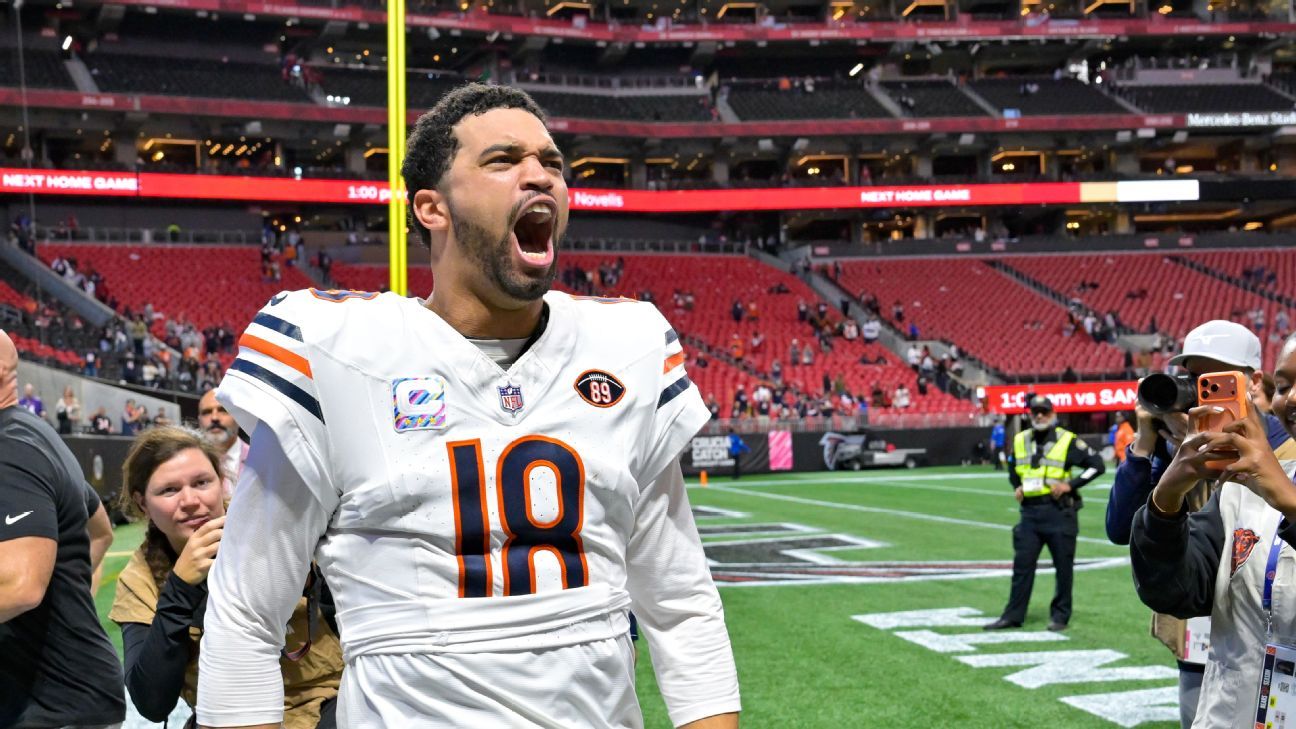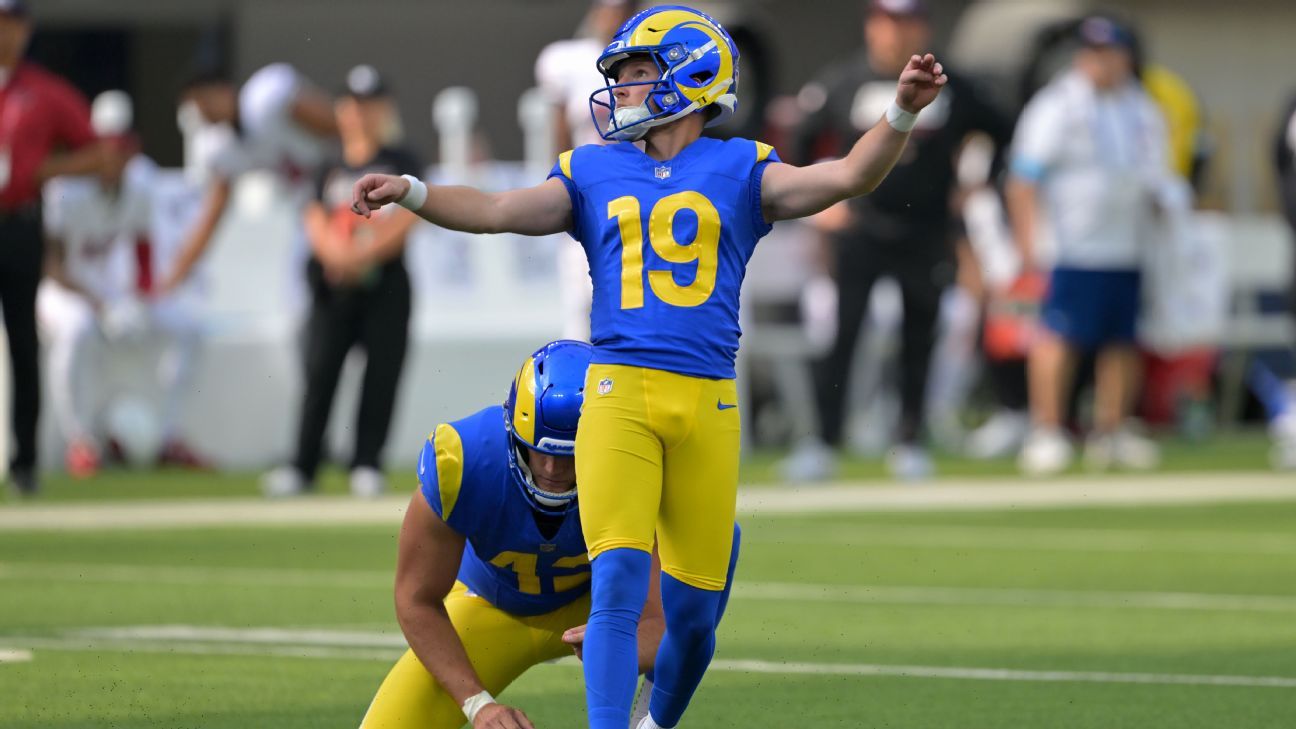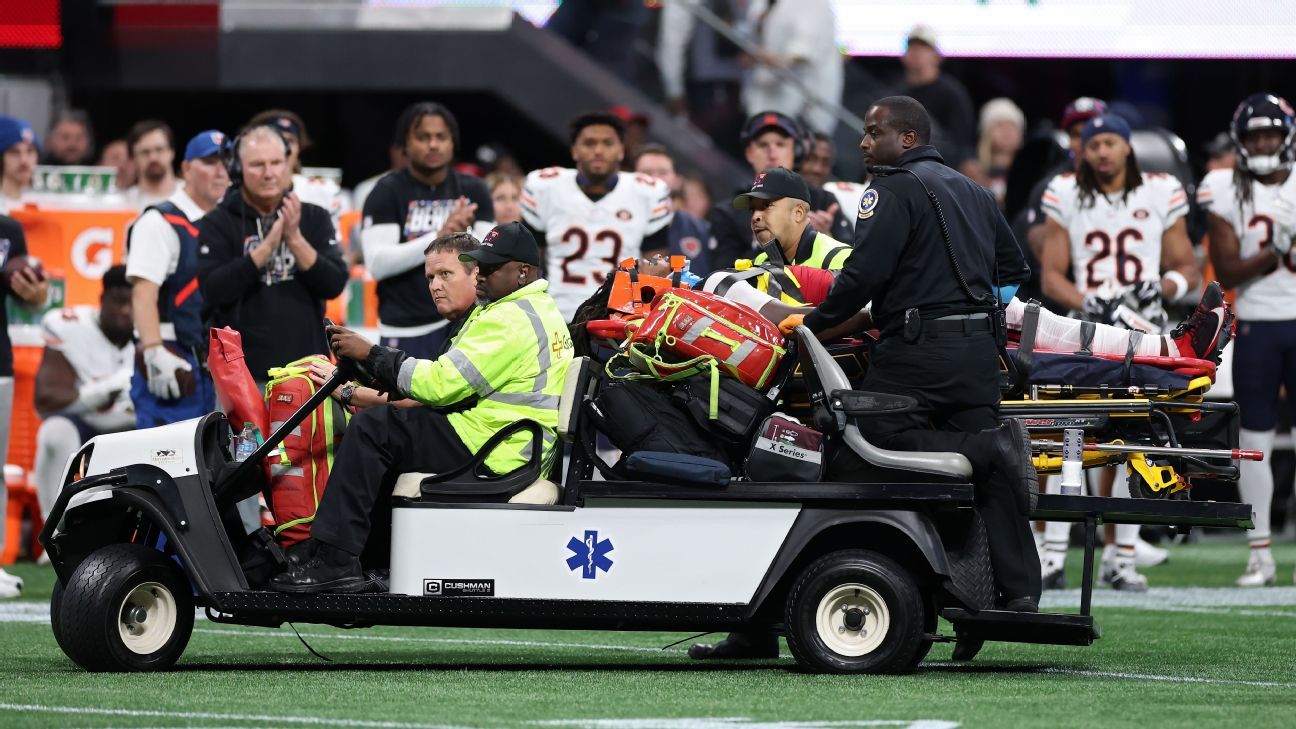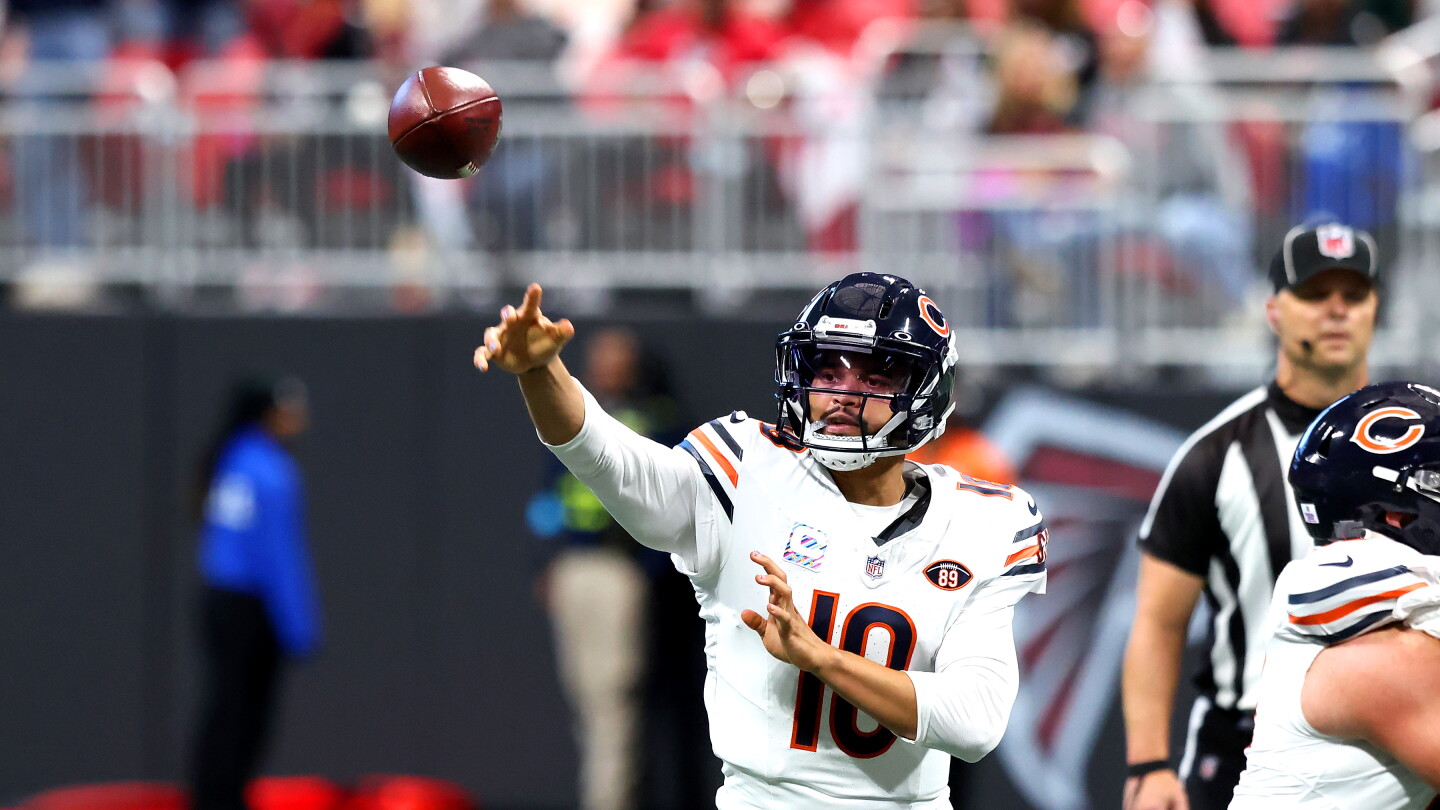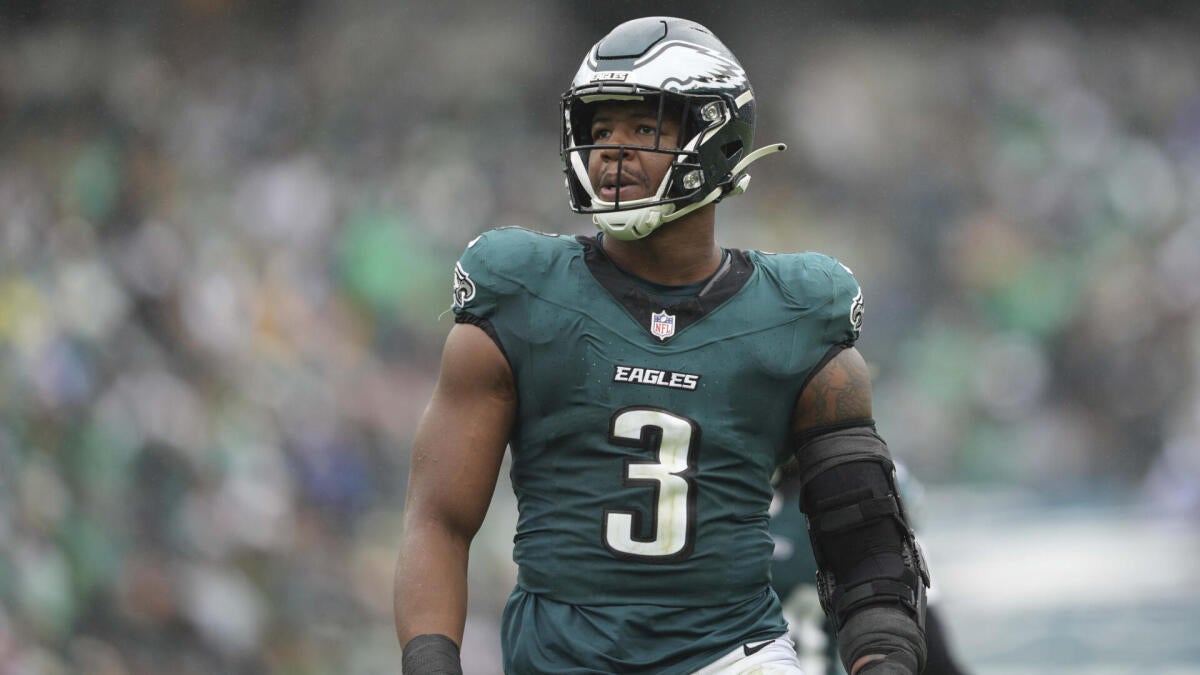
Eagles lose another starter to injury after team already without Jalen Hurts, Saquon Barkley, others
Nolan Smith exited with a concussion and will not return
Zachary Pereles
Our Yahoo pick'em pool
48 pointsFirst standing saved from Yahoo, so the weekly move starts next week.Yahoo, Fri, Oct 16, 10 PM ET.
Profizzpix leads with 49; Ellers is level with us on 48. Our points by week: 10, 8, 11, 8, 10, 1.
Notes from numbers measured for this build: the betting prices, how the pool is leaning, how each group graded, and how the model has actually done.
The pool is heavier on ARI than the market is
50% of the people in the pool took ARI against LA, while the betting prices put that side at 14% — 36 points apart. You win a pool by being right when other people are wrong, so a side everybody took is worth less than its chance of winning, and a side fewer people took is worth more. This says where the entrants are. It is not telling you to take the other side.
Betting markets
Where the pool is leaning hardest
The heaviest lean in the pool is PHI at TEN, where 13% of the people in it took the home side. These percentages come from the pool itself and go away once the week is played, so they are saved before kickoff each week.
The pool
LA is the week's biggest favourite
Across 3 independent markets — the sportsbook line and the prediction exchanges — LA is priced at 86% to beat ARI. In a survivor pool you only need to stay alive, so the biggest favourite is usually the safest pick of the week, and the one you least want to use up early, because you only get each club once.
Betting markets
SF blocks best, PIT worst
Graded on the two things a line actually controls: SF allowed pressure on — of dropbacks and averaged 3.39 yards before contact on runs, with 5 linemen playing nearly every snap. PIT sits at — pressure allowed and 2.22 yards before contact. Yards before contact is the line's work; what happens after belongs to the back.
Team grades
CAR rose the most this week, LA fell the furthest
This is the change from last week to this week, not the slower move since the preseason. CAR's overall grade climbed 2.9 points from week 5 to week 6, the biggest gain in the league. LA dropped the most, down 1.9 over the same week. Every team, every week, is on /rankings/trends.
Team grades
What the model is actually worth
On games it had never seen before, the model picks 66.5% and the betting market picks 66.4%. It does not beat the market, and we don't pretend it does. The full working, including everything that failed, is on the Model page.
The model
How much is actually riding on these prices
This week's game markets have 14,940,315 contracts traded on Kalshi and $4,000,384 on Polymarket, across 14 games. A market nobody has bet still shows a price. We only treat that price as a real chance when people have actually traded it and the buy and sell prices are close, and we keep both numbers so you can check.
Betting markets
Every sentence here is built from those numbers, and the numbers stay in the sentence so you can check them. Nobody writes them by hand, and a chatbot doesn't either. The site puts them together from the data.
Four ways of looking at the same game, each as the home team's chance. Vegas is the sportsbook's odds with the book's cut taken out, so it reads as a real chance. Kalshi andPolymarket are prices two people agreed on with their own money. Pool is how many Yahoo players took the home team. That's what the crowd did, not a probability.
| Game | Line | Vegas | Kalshi | Poly | Pool | Model |
|---|---|---|---|---|---|---|
| WAS @ SF | SF -7.5 | 79% | 79% | 79% | 78% | 78% |
| SEA @ DEN Final SEA 14, DEN 17 · pre-kick prices | SEA -2.5 | 42% | 44% | 44% | 36% | 41% |
| HOU @ JAX Final HOU 34, JAX 31 · pre-kick prices | JAX -2.5 | 56% | 57% | 56% | 77% | 56% |
| NYJ @ NE Final NYJ 19, NE 26 · pre-kick prices | NE -7.5 | 74% | 76% | 76% | 67% | 75% |
| BAL @ CLE Final BAL 10, CLE 13 · pre-kick prices | BAL -3 | 40% | 39% | 39% | 34% | 37% |
| TEN @ IND Final TEN 26, IND 20 · pre-kick prices | IND -6.5 | 72% | 74% | 74% | 75% | 71% |
| NO @ NYG Final NO 34, NYG 27 · pre-kick prices | NO -1.5 | 50% | 51% | 50% | 68% | 49% |
| CAR @ PHI Final CAR 25, PHI 14 · pre-kick prices | CAR -3 | 41% | 40% | 41% | 49% | 37% |
| PIT @ TB Final PIT 26, TB 19 · pre-kick prices | PIT -2.5 | 44% | 46% | 45% | 32% | 42% |
| CHI @ ATL Final CHI 31, ATL 23 · pre-kick prices | CHI -1.5 | 48% | 49% | 49% | 63% | 50% |
| ARI @ LA Final ARI 18, LA 16 · pre-kick prices | LA -12.5 | 84% | 87% | 87% | 50% | 85% |
| BUF @ LV Final BUF 33, LV 30 · pre-kick prices | BUF -5.5 | 32% | 32% | 32% | 28% | 30% |
| LAC @ KC Final LAC 6, KC 22 · pre-kick prices | KC -7.5 | 79% | 79% | 79% | 59% | 81% |
| DAL @ GB Final DAL 13, GB 23 · pre-kick prices | DAL -1.5 | 49% | 50% | 49% | 65% | 46% |
Every percentage is the chance the home team wins, so you can read a column straight down. A price is shown only when people have actually traded it: enough money changed hands, and the buy and sell prices are close. If almost nobody has bet a market, the number sitting there is not a forecast. Once a game kicks off it shows only the prices taken before kickoff. Live and settled prices aren't chances. If the three sources differ by more than 20 points on one game, the odd one out is held back. This week: 859,088 contracts on Kalshi and $60,368 on Polymarket across 1 games.
Listed starters who will not play, and a quarterback who had that job and still will not play after the depth chart names someone else. Other reserves stay on the club's injury report. Both lists refresh daily at midnight Eastern.
Depth charts come from the league's own published charts, refreshed daily (latest snapshot 2026-10-18 12:02). Team sites draw their injury lists in the browser, so a build can't read a table off the page. The league-wide feeds are used instead, and that limit is stated here.
Every priced game has the sportsbook, both exchanges and the pool within a few points of each other this week. That is a real finding, not missing data — there is simply no gap worth reporting.
Only stories that help with a pick: who's playing, who's hurt, the betting markets, fantasy usage, roster moves, and the weather. The same story isn't listed twice, and nothing already in the carousel above is repeated.
The closest lines on the board. These are the games the betting market thinks could go either way.
A quick look at every section, using the same numbers that section's own page uses.
Giants
Record, next game, live weather and injuries.
Teams
Every club, with its own page.
Standings
Best records of the 2026 season, computed from real game results.
Rankings
Ranked by record. A harder schedule breaks a tie. Each club's grade sits next to the record.
Stat Leaders
2026 season leaders. That's the latest season the public stats file has full player totals for.
Fantasy
Top point-per-reception scorers of 2026, added up from real box scores.
Pool Picks
This week's picks, the spread each was made against, and when it was made.
Playoff Picture
Who's in and who's out for 2026, worked out from the standings rules.
Ops
What is actually running, and what is still missing.